---
title: Cloudflare Web Analytics
description: Cloudflare Web Analytics helps you understand the performance of your web pages as experienced by your site visitors.
image: https://developers.cloudflare.com/core-services-preview.png
---
[Skip to content](#%5Ftop)
Was this helpful?
YesNo
[ Edit page ](https://github.com/cloudflare/cloudflare-docs/edit/production/src/content/docs/web-analytics/index.mdx) [ Report issue ](https://github.com/cloudflare/cloudflare-docs/issues/new/choose)
Copy page
# Cloudflare Web Analytics
Get vital web analytics for your website without compromising user privacy.
Available on all plans
Cloudflare Web Analytics helps you understand the performance of your web pages as experienced by your site visitors.
---
## Features
### Filters
Use filters to refine the data displayed in Web Analytics.
[ Use Filters ](https://developers.cloudflare.com/web-analytics/configuration-options/filters/)
### Rules
Use rules to configure tracking of Web Analytics for specific websites or paths.
[ Use Rules ](https://developers.cloudflare.com/web-analytics/configuration-options/rules)
### Dimensions
Use dimensions to categorize and organize various metrics or data types effectively.
[ Use Dimensions ](https://developers.cloudflare.com/web-analytics/data-metrics/dimensions)
---
## Related products
**[Analytics](https://developers.cloudflare.com/analytics/)**
Cloudflare visualizes the metadata collected by our products in the Cloudflare dashboard.
**[Speed](https://developers.cloudflare.com/speed/)**
Speed allows you to assess the performance of your website and get recommendations of Cloudflare products to enhance the website performance.
---
## More resources
[Resource hub](https://www.cloudflare.com/application-services/products/analytics/)
Refer to our latest resources to learn more about security, performance and reliability.
[Cloudflare blog](https://blog.cloudflare.com/privacy-first-web-analytics/)
Read articles about the latest updates about Web Analytics.
```json
{"@context":"https://schema.org","@type":"BreadcrumbList","itemListElement":[{"@type":"ListItem","position":1,"item":{"@id":"/directory/","name":"Directory"}},{"@type":"ListItem","position":2,"item":{"@id":"/web-analytics/","name":"Cloudflare Web Analytics"}}]}
```
---
---
title: About
description: Cloudflare Web Analytics provides free, privacy-first analytics for your website without changing your DNS or using Cloudflare’s proxy. Cloudflare Web Analytics helps you understand the performance of your web pages as experienced by your site visitors.
image: https://developers.cloudflare.com/core-services-preview.png
---
[Skip to content](#%5Ftop)
### Tags
[ Privacy ](https://developers.cloudflare.com/search/?tags=Privacy)
Was this helpful?
YesNo
[ Edit page ](https://github.com/cloudflare/cloudflare-docs/edit/production/src/content/docs/web-analytics/about.mdx) [ Report issue ](https://github.com/cloudflare/cloudflare-docs/issues/new/choose)
Copy page
# About
Cloudflare Web Analytics provides free, privacy-first analytics for your website without changing your DNS or using Cloudflare’s proxy. Cloudflare Web Analytics helps you understand the performance of your web pages as experienced by your site visitors.
All you need to enable Cloudflare Web Analytics is a Cloudflare account and a JavaScript snippet on your page to start getting information on page views and visitors. The JavaScript snippet (also known as a beacon) collects metrics using the Performance API, which is available in all major web browsers.
Web Analytics supports Adaptive Bit Rate (ABR). Cloudflare's servers will select the best resolution for each chart or table depending on the size of the data, the date range, your network connection, and other factors. For more information, refer to [Explaining Cloudflare's ABR Analytics ↗](https://blog.cloudflare.com/explaining-cloudflares-abr-analytics/).
The data displayed in Web Analytics is real user monitoring (RUM). For more information, refer to [Real User Monitoring ↗](https://en.wikipedia.org/wiki/Real%5Fuser%5Fmonitoring).
Cloudflare Web Analytics does not collect or use your visitors’ personal data.
[ Get started ](http://dash.cloudflare.com/sign-up/web-analytics) [ Learn more ](https://developers.cloudflare.com/web-analytics/data-metrics/)
```json
{"@context":"https://schema.org","@type":"BreadcrumbList","itemListElement":[{"@type":"ListItem","position":1,"item":{"@id":"/directory/","name":"Directory"}},{"@type":"ListItem","position":2,"item":{"@id":"/web-analytics/","name":"Cloudflare Web Analytics"}},{"@type":"ListItem","position":3,"item":{"@id":"/web-analytics/about/","name":"About"}}]}
```
---
---
title: Get started
description: Web analytics is now set up on your website, but it may take a few minutes for Web Analytics data to appear.
image: https://developers.cloudflare.com/core-services-preview.png
---
[Skip to content](#%5Ftop)
Was this helpful?
YesNo
[ Edit page ](https://github.com/cloudflare/cloudflare-docs/edit/production/src/content/docs/web-analytics/get-started/index.mdx) [ Report issue ](https://github.com/cloudflare/cloudflare-docs/issues/new/choose)
Copy page
# Get started
## Sites not proxied through Cloudflare
1. In the Cloudflare dashboard, go to the **Web Analytics** page.
[ Go to **Web analytics** ](https://dash.cloudflare.com/?to=/:account/web-analytics)
2. Select **Add a site**.
3. In **Set up hostname**, write your website's hostname.
4. Select the message box that appears to choose the hostname you have input and select **Done**.
5. Copy the JS snippet from **Manage site**. This is also where you can later edit the hostname you have just added.
6. (Optional) Select **View Analytics sites** to go back on the Web Analytics interface. If you prefer to continue setting up Web Analytics website, continue reading.
7. Add the JS snippet to any of your website’s HTML pages before the ending body tag.
Web analytics is now set up on your website, but it may take a few minutes for Web Analytics data to appear.
Repeat steps 3-7 for all the websites you want to track with Web Analytics by selecting **Add a site** from Web Analytics. In **Web Analytics Sites**, select **Manage site** inside each website's card to adjust Web Analytics for your site at any time.
For more information on how many sites you can track, refer to [Limits](https://developers.cloudflare.com/web-analytics/limits/).
---
## Sites proxied through Cloudflare
1. In the Cloudflare dashboard, go to the **Web Analytics** page.
[ Go to **Web analytics** ](https://dash.cloudflare.com/?to=/:account/web-analytics)
2. Select **Add a site**.
3. Select a hostname from the drop-down menu > **Done**.
Your website is now using Web Analytics through the automatic setup, which is enabled by default.
You always have the option to go to **Manage Site** and change the automatic setup to one of the following:
* **Enable, excluding visitor data in the EU** \- The JS Snippet will not be injected for visitors from the EU.
* **Enable with JS Snippet installation** \- The JS Snippet needs to be installed manually.
* **Disable** \- The JS Snippet will not be injected and has been disabled.
Repeat these steps for all of the websites you want to track with Web Analytics. Web Analytics is enabled by default for sites proxied through Cloudflare that previously used Browser Insights. Adjust Web Analytics for your site at any time by selecting **Manage site** from Web Analytics.
For more information on how many sites you can track, refer to [Limits](https://developers.cloudflare.com/web-analytics/limits/).
For more information on how to configure which sites or pages you track with Web Analytics, refer to [Rules](https://developers.cloudflare.com/web-analytics/configuration-options/rules/).
Important
If you have a `Cache-Control` header set to `public, no-transform`, Cloudflare proxy will not be able to modify the original payload of the website. Therefore, the Beacon script will not be automatically injected to your site, and Web Analytics will not work. Refer to [Origin cache control](https://developers.cloudflare.com/cache/concepts/cache-control/) for more information.
---
## Pages projects
Cloudflare Pages offers a one-click setup for Web Analytics:
1. In the Cloudflare dashboard, go to the **Workers & Pages** page.
[ Go to **Workers & Pages** ](https://dash.cloudflare.com/?to=/:account/workers-and-pages)
2. Select your Pages project.
3. Go to **Metrics** and select **Enable** under Web Analytics.
Cloudflare will automatically add the JavaScript snippet to your Pages site on the next deployment.
```json
{"@context":"https://schema.org","@type":"BreadcrumbList","itemListElement":[{"@type":"ListItem","position":1,"item":{"@id":"/directory/","name":"Directory"}},{"@type":"ListItem","position":2,"item":{"@id":"/web-analytics/","name":"Cloudflare Web Analytics"}},{"@type":"ListItem","position":3,"item":{"@id":"/web-analytics/get-started/","name":"Get started"}}]}
```
---
---
title: Notifications
description: Web Analytics uses Cloudflare's Notification service. When enabled, Web Analytics sends you a weekly report with aggregate visits, page views and median page load time for all your sites, so you can monitor their performance.
image: https://developers.cloudflare.com/core-services-preview.png
---
[Skip to content](#%5Ftop)
Was this helpful?
YesNo
[ Edit page ](https://github.com/cloudflare/cloudflare-docs/edit/production/src/content/docs/web-analytics/get-started/notifications.mdx) [ Report issue ](https://github.com/cloudflare/cloudflare-docs/issues/new/choose)
Copy page
# Notifications
Web Analytics uses Cloudflare's Notification service. When enabled, Web Analytics sends you a weekly report with aggregate visits, page views and median page load time for all your sites, so you can monitor their performance.
Refer to [Cloudflare Notifications](https://developers.cloudflare.com/notifications/get-started/) for more information on how to set up an alert.
Weekly summary
**Who is it for?**
Customers using [Web Analytics](https://developers.cloudflare.com/web-analytics/) to monitor their website's performance.
**Other options / filters**
None.
**Included with**
All Cloudflare plans.
**What should you do if you receive one?**
No action is needed. This notification is a weekly summary with reports from your Web Analytics account. Refer to [Notifications](https://dash.cloudflare.com/?to=/:account/notifications) in the Cloudflare dashboard to refine your notifications settings.
```json
{"@context":"https://schema.org","@type":"BreadcrumbList","itemListElement":[{"@type":"ListItem","position":1,"item":{"@id":"/directory/","name":"Directory"}},{"@type":"ListItem","position":2,"item":{"@id":"/web-analytics/","name":"Cloudflare Web Analytics"}},{"@type":"ListItem","position":3,"item":{"@id":"/web-analytics/get-started/","name":"Get started"}},{"@type":"ListItem","position":4,"item":{"@id":"/web-analytics/get-started/notifications/","name":"Notifications"}}]}
```
---
---
title: RUM beacon for Web Analytics
image: https://developers.cloudflare.com/core-services-preview.png
---
[Skip to content](#%5Ftop)
Was this helpful?
YesNo
[ Edit page ](https://github.com/cloudflare/cloudflare-docs/edit/production/src/content/docs/web-analytics/get-started/rum-beacon.mdx) [ Report issue ](https://github.com/cloudflare/cloudflare-docs/issues/new/choose)
Copy page
# RUM beacon for Web Analytics
```json
{"@context":"https://schema.org","@type":"BreadcrumbList","itemListElement":[{"@type":"ListItem","position":1,"item":{"@id":"/directory/","name":"Directory"}},{"@type":"ListItem","position":2,"item":{"@id":"/web-analytics/","name":"Cloudflare Web Analytics"}},{"@type":"ListItem","position":3,"item":{"@id":"/web-analytics/get-started/","name":"Get started"}},{"@type":"ListItem","position":4,"item":{"@id":"/web-analytics/get-started/rum-beacon/","name":"RUM beacon for Web Analytics"}}]}
```
---
---
title: Web Analytics for SPAs
description: Cloudflare Web Analytics can automatically track user interactions on Single Page Applications (SPAs) by overriding the History API's pushState function and listening to the onpopstate event. Note that hash-based routers are not supported.
image: https://developers.cloudflare.com/core-services-preview.png
---
[Skip to content](#%5Ftop)
Was this helpful?
YesNo
[ Edit page ](https://github.com/cloudflare/cloudflare-docs/edit/production/src/content/docs/web-analytics/get-started/web-analytics-spa.mdx) [ Report issue ](https://github.com/cloudflare/cloudflare-docs/issues/new/choose)
Copy page
# Web Analytics for SPAs
Cloudflare Web Analytics can automatically track user interactions on Single Page Applications (SPAs) by overriding the History API's `pushState` function and listening to the `onpopstate` event. Note that hash-based routers are not supported.
## Disable SPA measurement
If you want to disable the automatic tracking for SPAs, you can do so by adding the `spa` option with a value of `false` in the data attribute of the script tag, as shown below:
```
```
### Google Tag Manager (GTM)
If you are using Google Tag Manager (GTM), you can disable SPA tracking by passing the spa option via the query string in the script URL:
```
```
```json
{"@context":"https://schema.org","@type":"BreadcrumbList","itemListElement":[{"@type":"ListItem","position":1,"item":{"@id":"/directory/","name":"Directory"}},{"@type":"ListItem","position":2,"item":{"@id":"/web-analytics/","name":"Cloudflare Web Analytics"}},{"@type":"ListItem","position":3,"item":{"@id":"/web-analytics/get-started/","name":"Get started"}},{"@type":"ListItem","position":4,"item":{"@id":"/web-analytics/get-started/web-analytics-spa/","name":"Web Analytics for SPAs"}}]}
```
---
---
title: Limits
description: Cloudflare limits the number of sites for which you can track web analytics, as well as the number of rules allowed for each plan type. Refer to the following tables for more information.
image: https://developers.cloudflare.com/core-services-preview.png
---
[Skip to content](#%5Ftop)
Was this helpful?
YesNo
[ Edit page ](https://github.com/cloudflare/cloudflare-docs/edit/production/src/content/docs/web-analytics/limits.mdx) [ Report issue ](https://github.com/cloudflare/cloudflare-docs/issues/new/choose)
Copy page
# Limits
Cloudflare limits the number of sites for which you can track web analytics, as well as the number of rules allowed for each plan type. Refer to the following tables for more information.
## Site limits
Cloudflare limits the number of sites for which you can track web analytics when they are not proxied by Cloudflare.
| Site type | Limit |
| ------------------------------ | -------- |
| Not proxied through Cloudflare | 10 |
| Proxied through Cloudflare | No limit |
## Rules limits
Cloudflare limits the number of Web Analytics rules you can have by plan type. For plans with a limit of zero, Web Analytics injects the JS snippet on all subdomains.
Rules are only available for sites proxied through Cloudflare.
| Plan type | Rules limit |
| ---------- | ----------- |
| Free | 0 |
| Pro | 5 |
| Business | 20 |
| Enterprise | 100 |
```json
{"@context":"https://schema.org","@type":"BreadcrumbList","itemListElement":[{"@type":"ListItem","position":1,"item":{"@id":"/directory/","name":"Directory"}},{"@type":"ListItem","position":2,"item":{"@id":"/web-analytics/","name":"Cloudflare Web Analytics"}},{"@type":"ListItem","position":3,"item":{"@id":"/web-analytics/limits/","name":"Limits"}}]}
```
---
---
title: FAQs
description: Below you will find answers to our most commonly asked questions. If you cannot find the answer you are looking for, refer to the community page to explore more resources.
image: https://developers.cloudflare.com/core-services-preview.png
---
[Skip to content](#%5Ftop)
Was this helpful?
YesNo
[ Edit page ](https://github.com/cloudflare/cloudflare-docs/edit/production/src/content/docs/web-analytics/faq.mdx) [ Report issue ](https://github.com/cloudflare/cloudflare-docs/issues/new/choose)
Copy page
# FAQs
Below you will find answers to our most commonly asked questions. If you cannot find the answer you are looking for, refer to the [community page ↗](https://community.cloudflare.com/) to explore more resources.
* [Errors](#errors)
* [Setup](#setup)
* [Functionality](#functionality)
## Errors
### When I add the beacon to my website and load the webpage, I see an error that includes `is not allowed by Access-Control-Allow-Origin` (CORS). What is happening?
This error usually occurs when the hostname of the site loading the analytics does not match the name of the analytics site configured in the dashboard. Double-check that they are identical.
Cloudflare matches hostnames based on a postfix. For example, if you set up analytics for `example.com`, we will allow analytics from `www.example.com`, `blog.staging.example.com`, and `fooexample.com`. However, we will not allow analytics from `example.com.br`.
You may also see this error if the site does not send a `Referer` or `Origin` header. The `Referer` header is required (do not try to use the `Referrer-policy` header instead). We have a change in-flight now that only the `Origin` header will be required – we believe there is no way to disable that in the browser.
### The analytics beacon is blocked by ad-blockers (including adblockplus, Brave, DuckDuckGo extension, etc). Why is that?
Cloudflare is aware that the analytics beacon is blocked by these services.
While Cloudflare Web Analytics uses a JavaScript beacon, Cloudflare’s edge analytics cannot be blocked because we can measure every request that is received. Edge analytics are available to any customer who proxies traffic through Cloudflare. Currently, users on Pro, Business, and Enterprise plans get advanced web analytics powered by our edge logs.
### Why am I not seeing all the metrics for single-page application (SPA) or multiple-page application (MPA)?
Every route change that occurs in the single-page app will send the measurement of the route before the route is changed to the beacon endpoint. The measurement for the last route change will be sent whenever the user leaves the tab or closes the browser window. That will trigger `visibilityState` to a hidden state. Whenever that happens, Beacon JS sends the payload using the [Navigator.sendBeacon method ↗](https://developer.mozilla.org/en-US/docs/Web/API/Navigator/sendBeacon) that should not be cancelled even when the browser window is closed. However, due to compatibility, old browsers would fallback to using AJAX (`XmlHttpRequest`), which can be cancelled when the browser window is closed, so the last payload that gets sent to the beacon endpoint can be lost. Also, due to various network conditions, there can be data loss when the payload is sent to the beacon endpoint.
### For the same site, why would I see more data reported with an automatic setup?
Unless you are using Rules to control which pages to be measured, using [automatic setup](https://developers.cloudflare.com/web-analytics/get-started/#sites-proxied-through-cloudflare) will inject the JS snippet on all pages (sub-domains) under the zone.
If you used a [manual setup](https://developers.cloudflare.com/web-analytics/get-started/#sites-not-proxied-through-cloudflare) instead, only those pages that render the JS snippet will be reported.
Note
Since only one JS snippet can be rendered and used per page, you cannot have multiple snippets on the same page.
### My website is proxied through Cloudflare, but Web Analytic's automatic setup is not working.
If you have a `Cache-Control` header set to `public, no-transform`, Cloudflare proxy will not be able to modify the original payload of the website. Therefore, the Beacon script will not be automatically injected to your site, and Web Analytics will not work. Refer to [Origin cache control](https://developers.cloudflare.com/cache/concepts/cache-control/) for more information.
---
## Setup
### I am proxying my site through Cloudflare. Should I manually add the JS beacon?
You can, but you do not have to. Cloudflare Web Analytics is designed primarily for customers who do not use Cloudflare's proxy to measure their web traffic.
Existing Cloudflare customers can access analytics collected from our edge on the **Analytics** tab of the dashboard. You can also enable Web Analytics to measure performance using JavaScript.
Using a domain proxied through Cloudflare with [automatic setup](https://developers.cloudflare.com/web-analytics/get-started/#sites-proxied-through-cloudflare) will report stats back to your own domain's `/cdn-cgi/rum` endpoint. If you have installed JS snippet yourself (a [manual setup](https://developers.cloudflare.com/web-analytics/get-started/#sites-not-proxied-through-cloudflare)), it will report back to `cloudflareinsights.com/cdn-cgi/rum` endpoint.
### Can I add Web Analytics to my site using a tag manager like Google Tag Manager (GTM)?
Yes. Instead of embedding the script using a tag manager as shown here:
```
```
Add the following script:
```
```
### Can I use the same JS Snippet for a different domain?
No. However, if the apex domain (also known as "root domain" or "naked domain") is the same, you can use the same site tag. For example, if you have provided us a hostname `example.com` when registering a site, you can use the JS snippet from that site for `abc.example.com` and `def.example.com` since they use the same apex domain. When payload gets sent to the beacon endpoint, we validate the hostname with postfix matching, so if your domain shares the same apex domain, that would work.
### Can I use automatic setup with a DNS-only domain (CNAME setup)?
No, you can only use the [automatic setup](https://developers.cloudflare.com/web-analytics/get-started/#sites-proxied-through-cloudflare) with JS snippet injection if traffic to your domain is proxied through Cloudflare (orange-clouded).
If you have a DNS-only domain, you will have to do a [manual setup](https://developers.cloudflare.com/web-analytics/get-started/#sites-not-proxied-through-cloudflare) instead.
### What prevents the JS Snippet from being added to a page?
For Cloudflare to automatically add the JavaScript snippet, your pages need to have valid HTML.
For example, Cloudflare would not be able to enable Web Analytics on a page like this:
index.html
```
Hello world.
```
For Web Analytics to correctly insert the JavaScript snippet, you would need valid HTML output, such as:
index.html
```
Title
Hello world.
```
---
## Functionality
### Can I see server-side analytics by URL?
Web Analytics only displays client-side analytics. All Cloudflare customers who proxy their traffic also get analytics based on traffic at their edge.
Currently, users on Pro, Business, and Enterprise plans get advanced HTTP traffic analytics, which is the only way to see features like a breakdown of traffic by URL based on server-side analytics.
### What is the period of time I can access data in Web Analytics?
Currently, you can access data for the previous six months.
### Does Cloudflare Web Analytics support UTM parameters?
Not yet. UTM parameters are special query string parameters that can help track where traffic is coming from. Currently, Cloudflare Web Analytics do not log query strings to avoid collecting potentially sensitive data, but we may add support for this in the future.
### Does Web Analytics support custom events?
Not yet, but we may add support for this in the future.
### Can I track more than one website with Web Analytics?
Yes. Right now there is a soft limit of ten sites per account, but that can be adjusted by contacting Cloudflare support.
### When does the beacon send metrics to the `/cdn-cgi/rum/` endpoint?
For traditional websites, not Single Page Applications (SPAs), the Web Analytics beacon reports to the `/cdn-cgi/rum/` endpoint when the page has finished loading (load event) and when the user leaves the page. For Single Page Applications, additional metrics are sent for every route change to capture the page load event.
```json
{"@context":"https://schema.org","@type":"BreadcrumbList","itemListElement":[{"@type":"ListItem","position":1,"item":{"@id":"/directory/","name":"Directory"}},{"@type":"ListItem","position":2,"item":{"@id":"/web-analytics/","name":"Cloudflare Web Analytics"}},{"@type":"ListItem","position":3,"item":{"@id":"/web-analytics/faq/","name":"FAQs"}}]}
```
---
---
title: Changelog
description: Cloudflare occasionally updates the beacon.min.js file to improve Web Analytics functionality. The table below includes a log of what changed in the beacon.min.js file and when.
image: https://developers.cloudflare.com/core-services-preview.png
---
[Skip to content](#%5Ftop)
Was this helpful?
YesNo
[ Edit page ](https://github.com/cloudflare/cloudflare-docs/edit/production/src/content/docs/web-analytics/changelog.mdx) [ Report issue ](https://github.com/cloudflare/cloudflare-docs/issues/new/choose)
Copy page
# Changelog
Cloudflare occasionally updates the `beacon.min.js` file to improve Web Analytics functionality. The table below includes a log of what changed in the `beacon.min.js` file and when.
[ Subscribe to RSS ](https://developers.cloudflare.com/web-analytics/changelog/index.xml)
## 2024-06-11
Enhanced to include reporting of Server-Timing headers.
## 2024-05-22
Introducing new metric fields, transferSize and decodedBodySize are included.
## 2024-04-17
Introducing new metric fields, deliveryType (dt) and navigationType (nt) are included.
## 2023-10-18
Manages A/B testing tags.
## 2023-07-25
Fixed ETag format in the response header.
## 2023-07-13
Fixed the issue that was causing an illegal invocation error.
## 2023-04-19
Reports additional LCP diagnostic information using web-vitals library's attribution build.
## 2023-04-06
Updated webpack configuration to output code in ECMAScript 3 (ES3) format.
## 2023-03-23
Updated Google's web-vitals library (version 3.1.1) and removed experimental `server-timing` header.
## 2022-10-17
Updated to report new metrics such as time to first byte (TTFB), interaction to next paint (INP), and first contentful paint (FCP). Additionally, it reports `navigator.webdriver`, `server-timing` header (experimental), and protocol info (`nextHopProtocol`).
## 2021-12-14
Improved site filtering.
## 2021-11-16
When using the automatic installation feature of the JavaScript Beacon (available only to customers proxied through Cloudflare - also known as orange-clouded customers),[Subresource Integrity (SRI)](https://developer.mozilla.org/en-US/docs/Web/Security/Subresource%5FIntegrity) is now enabled by default. SRI is a security feature that enables browsers to verify that resources they fetch are delivered without unexpected manipulation.
## 2021-09-01
Improved to report debugging information for Core Web Vitals.
## 2021-05-28
`startsWith` function replaced with `indexOf` function, which prevents rendering if multiple beacon scripts are loaded.
## 2021-05-12
Reporting endpoint changed from `/cdn-cgi/beacon/performance` to `/cdn-cgi/rum` (for Browser Insights only).
```json
{"@context":"https://schema.org","@type":"BreadcrumbList","itemListElement":[{"@type":"ListItem","position":1,"item":{"@id":"/directory/","name":"Directory"}},{"@type":"ListItem","position":2,"item":{"@id":"/web-analytics/","name":"Cloudflare Web Analytics"}},{"@type":"ListItem","position":3,"item":{"@id":"/web-analytics/changelog/","name":"Changelog"}}]}
```
---
---
title: Filters
description: Learn how to use filters in Cloudflare Web Analytics.
image: https://developers.cloudflare.com/core-services-preview.png
---
[Skip to content](#%5Ftop)
Was this helpful?
YesNo
[ Edit page ](https://github.com/cloudflare/cloudflare-docs/edit/production/src/content/docs/web-analytics/configuration-options/filters.mdx) [ Report issue ](https://github.com/cloudflare/cloudflare-docs/issues/new/choose)
Copy page
# Filters
To filter the data shown on Web Analytics:
1. In the Cloudflare dashboard, go to the **Web Analytics** page.
[ Go to **Web analytics** ](https://dash.cloudflare.com/?to=/:account/web-analytics)
2. Select the website you want to check.
3. Select **Add filter**.
4. In the **New filter** box, choose your criteria from the dropdown. Refer to the [Dimensions](https://developers.cloudflare.com/web-analytics/data-metrics/dimensions/) page for a list of available filters and their descriptions.
5. Select **Apply**.
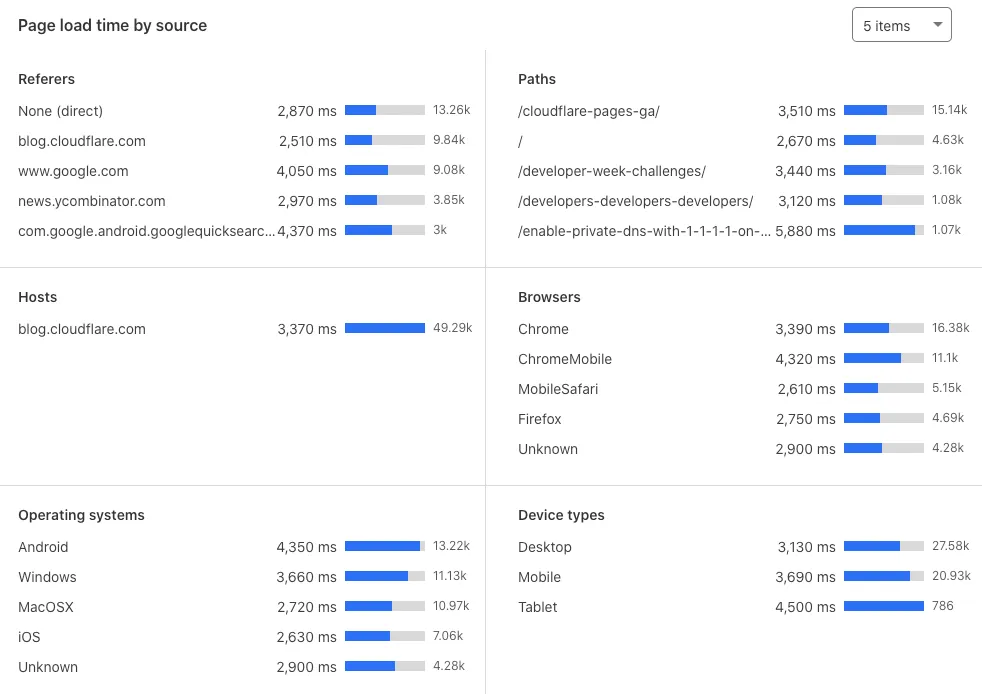
### Additional tips
* By default, Web Analytics shows data for the previous 24 hours. Adjust the time range using the dropdown menu above the graph.
* Select and drag the cursor on the graph to choose a custom time period.
* Scroll below the graph to view detailed breakdowns, for instance of top visits by country or by device type.
```json
{"@context":"https://schema.org","@type":"BreadcrumbList","itemListElement":[{"@type":"ListItem","position":1,"item":{"@id":"/directory/","name":"Directory"}},{"@type":"ListItem","position":2,"item":{"@id":"/web-analytics/","name":"Cloudflare Web Analytics"}},{"@type":"ListItem","position":3,"item":{"@id":"/web-analytics/configuration-options/","name":"Configuration options"}},{"@type":"ListItem","position":4,"item":{"@id":"/web-analytics/configuration-options/filters/","name":"Filters"}}]}
```
---
---
title: Rules
description: Use Rules to configure whether to track Web Analytics for specific websites or paths. By default, Web Analytics automatically creates a single rule for the zone that injects the JavaScript (JS) snippet for all pages.
image: https://developers.cloudflare.com/core-services-preview.png
---
[Skip to content](#%5Ftop)
Was this helpful?
YesNo
[ Edit page ](https://github.com/cloudflare/cloudflare-docs/edit/production/src/content/docs/web-analytics/configuration-options/rules.mdx) [ Report issue ](https://github.com/cloudflare/cloudflare-docs/issues/new/choose)
Copy page
# Rules
Use **Rules** to configure whether to track Web Analytics for specific websites or paths. By default, Web Analytics automatically creates a single rule for the zone that injects the JavaScript (JS) snippet for all pages.
Rules are only available for sites proxied through Cloudflare. For more information, refer to [Limits](https://developers.cloudflare.com/web-analytics/limits/).
1. In the Cloudflare dashboard, go to the **Web Analytics** page.
[ Go to **Web analytics** ](https://dash.cloudflare.com/?to=/:account/web-analytics)
2. Find the site you want to configure and select **Manage site**.
3. Select **Advanced options** \> **Add rule**.
4. Select the **Action** and fill in the hostname and path(s) you want to add a rule for.
5. If you want to add additional rules, select **Add rule**. Otherwise select **Update** to save the rule.
Warning
Configuration rules have precedence over any Web Analytics rules. If a Web Analytics rule turns on analytics measurements for an incoming request and the same request matches a configuration rule turning off Web Analytics, the configuration rule will win.
```json
{"@context":"https://schema.org","@type":"BreadcrumbList","itemListElement":[{"@type":"ListItem","position":1,"item":{"@id":"/directory/","name":"Directory"}},{"@type":"ListItem","position":2,"item":{"@id":"/web-analytics/","name":"Cloudflare Web Analytics"}},{"@type":"ListItem","position":3,"item":{"@id":"/web-analytics/configuration-options/","name":"Configuration options"}},{"@type":"ListItem","position":4,"item":{"@id":"/web-analytics/configuration-options/rules/","name":"Rules"}}]}
```
---
---
title: Core Web Vitals
description: Core Web Vitals are high-level metrics designed by Google to capture the user experience. Three core Web Vitals metrics are measured: Largest Contentful Paint, First Input Delay, and Cumulative Layout Shift. Each of these metrics is automatically assigned a rating of Good, Needs Improvement, or Poor based on the industry standard methodology and testing designed by Google. Page load time statistics are supplemented by First Paint and First Contentful Paint.
image: https://developers.cloudflare.com/core-services-preview.png
---
[Skip to content](#%5Ftop)
Was this helpful?
YesNo
[ Edit page ](https://github.com/cloudflare/cloudflare-docs/edit/production/src/content/docs/web-analytics/data-metrics/core-web-vitals.mdx) [ Report issue ](https://github.com/cloudflare/cloudflare-docs/issues/new/choose)
Copy page
# Core Web Vitals
[Core Web Vitals ↗](https://www.cloudflare.com/learning/performance/what-are-core-web-vitals/) are high-level metrics designed by Google to capture the user experience. Three core Web Vitals metrics are measured: Largest Contentful Paint, First Input Delay, and Cumulative Layout Shift. Each of these metrics is automatically assigned a rating of Good, Needs Improvement, or Poor based on the industry standard methodology and testing designed by Google. Page load time statistics are supplemented by First Paint and First Contentful Paint.
Note
Core Web Vitals is currently only supported in Chromium browsers, with Safari and Firefox coming soon.
## Access Core Web Vitals
Core Web Vitals enables you to easily pinpoint which elements in a web page are affecting the user's experience while browsing your website, in a visual form. To access Core Web Vitals:
1. In the Cloudflare dashboard, go to the **Web Analytics** page.
[ Go to **Web analytics** ](https://dash.cloudflare.com/?to=/:account/web-analytics)
2. Select your website and select **Core Web Vitals**.
### Core Web Vitals metrics
Core Web Vitals is divided into three main sections, each one with information about a specific feature that affects user experience:
* [Largest Contentful Paint (LCP) ↗](https://web.dev/optimize-lcp/): Measures perceived load speed by the user. It returns how long the main content of the page takes to be loaded.
* [Interaction to Next Paint (INP) ↗](https://web.dev/inp/): Measures user interface responsiveness – how quickly a website responds to user interactions like clicks or key presses.
* [Cumulative Layout Shift (CLS) ↗](https://web.dev/optimize-cls/): Measures visual stability, that is, if there are shifts in the page layout as the various elements are being loaded into view.
Each of these metrics represents an impact to the user experience, which is quantified and graded by Web Analytics.
Cloudflare Web Analytics offers interactive exploration in Core Web Vitals by allowing you to filter data by URL, Browser, Operating System, Country, and Element.
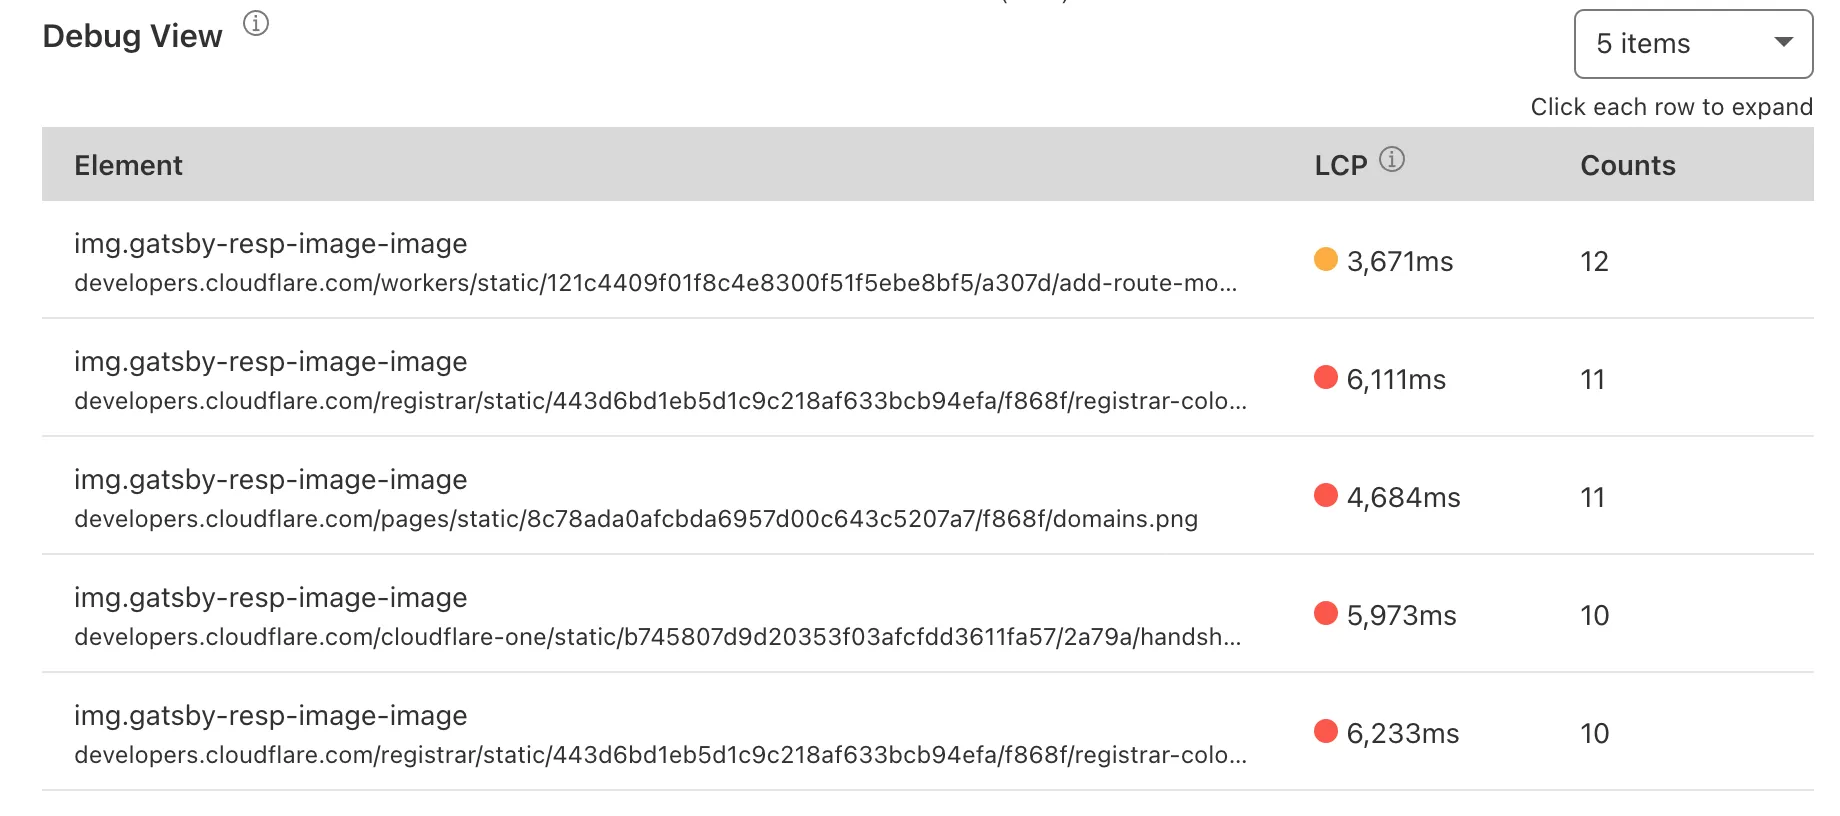
### Debug view
Below each graph, the Debug View section has the top five elements with a negative impact on each metric. Selecting the elements shown in the data table gives you more details about them.
Each table — LCP, INP, and CLS — also shows you the performance of these elements in the 75th percentile (P75) at a glance. Selecting in each row of the table lets you expand the element and have access to more information, including P50, P90 and P99 metrics.
These numbers refer to how an element performs relatively to others in your page. For example, if an element takes 3,900 ms to load and is in the 75 percentile, this means that it is slower to load than 75% of the elements in your page.
## Information collected
Web Analytics uses its lightweight JavaScript beacon to collect the information Vitals Explorer uses. It does not use any client-side state, such as cookies or `localStorage`, to collect usage metrics. Vitals Explorer also does not fingerprint individuals via their IP address, User Agent string, or any other data.
### Common data collected for all Core Web Vitals metrics
#### Element
A CSS selector representing the DOM node. With this string, you can use `document.querySelector()` in the dev console of your browser to find out which DOM node has a negative impact on your scores/values.
#### Path
The URL path at the time the Core Web Vitals are captured.
#### Value
[The metric value ↗](https://web.dev/cls/#layout-shift-score) for each Core Web Vitals. This value is in milliseconds for LCP or NIP and a score for CLS.
### Additional data collected for Largest Contentful Paint
#### URL
The source URL (such as image, text, web fonts).
#### Size
The source object's size in bytes.
### Additional data collected for Cumulative Layout Shift
Layout information is a JSON value that includes width, height, x axis position, y axis position, left, right, top, and bottom. These values represent the layout shifts that happen on the page.
#### CurrentRect
Captures the layout information of the DOM element with the largest area, after the shift in the page has occurred. This JSON value is shown as **Current** in the **Debug View** section. To access it, scroll to the **Cumulative Layout Shifts (CLS)** graphic > **Debug View**. Select any element from that table to access the **Layout Shifts** section, where **Current** is presented.
#### PreviousRect
Captures the layout information of the DOM element with the largest area, before the shift in the page has occurred. This JSON value is shown as **Previous** in the **Debug View** section. To access it, scroll to the **Cumulative Layout Shifts (CLS)** graphic > **Debug View**. Select any element from that table to access the **Layout Shifts** section, where **Previous** is presented.
```json
{"@context":"https://schema.org","@type":"BreadcrumbList","itemListElement":[{"@type":"ListItem","position":1,"item":{"@id":"/directory/","name":"Directory"}},{"@type":"ListItem","position":2,"item":{"@id":"/web-analytics/","name":"Cloudflare Web Analytics"}},{"@type":"ListItem","position":3,"item":{"@id":"/web-analytics/data-metrics/","name":"Data and metrics"}},{"@type":"ListItem","position":4,"item":{"@id":"/web-analytics/data-metrics/core-web-vitals/","name":"Core Web Vitals"}}]}
```
---
---
title: Data origin and collection
description: Web Analytics relies on the performance.getEntriesByType('navigation') object to collect metrics about page load performance. If Navigation Timing Level 2 is not supported, then performance.timing (Level 1) is used.
image: https://developers.cloudflare.com/core-services-preview.png
---
[Skip to content](#%5Ftop)
Was this helpful?
YesNo
[ Edit page ](https://github.com/cloudflare/cloudflare-docs/edit/production/src/content/docs/web-analytics/data-metrics/data-origin-and-collection.mdx) [ Report issue ](https://github.com/cloudflare/cloudflare-docs/issues/new/choose)
Copy page
# Data origin and collection
Web Analytics relies on the `performance.getEntriesByType('navigation')` object to collect metrics about page load performance. If Navigation Timing Level 2 is not supported, then [performance.timing (Level 1) ↗](https://developer.mozilla.org/en-US/docs/Web/API/Performance/timing) is used.
Refer to the [W3C Processing Model ↗](https://www.w3.org/TR/navigation-timing-2/#processing-model) for a visual depiction of the sequence of timing events for web page loads.
## Data collection and reporting
Web Analytics collects the minimum amount of information - timing metrics - to show customers how their websites perform. Cloudflare does not track individual end users across our customers’ Internet properties.
The Web Analytics performance beacon loads from `https://static.cloudflareinsights.com/beacon.min.js`. You may need to update your [Content Security Policy (CSP)](https://developer.mozilla.org/en-US/docs/Web/HTTP/CSP) settings to load this script.
Beacon data is sent to `https:///cdn-cgi/rum` for sites proxied through Cloudflare or `https://cloudflareinsights.com/cdn-cgi/rum` for sites not proxied through Cloudflare. Core Web Vital metrics are reported when the `visibilityState` is hidden for the first time after the page load event is triggered.
```json
{"@context":"https://schema.org","@type":"BreadcrumbList","itemListElement":[{"@type":"ListItem","position":1,"item":{"@id":"/directory/","name":"Directory"}},{"@type":"ListItem","position":2,"item":{"@id":"/web-analytics/","name":"Cloudflare Web Analytics"}},{"@type":"ListItem","position":3,"item":{"@id":"/web-analytics/data-metrics/","name":"Data and metrics"}},{"@type":"ListItem","position":4,"item":{"@id":"/web-analytics/data-metrics/data-origin-and-collection/","name":"Data origin and collection"}}]}
```
---
---
title: Dimensions
description: Dimensions are the labels used to describe different types of metrics or data. For example, Referer is the data collected from external links referring visits to a page, while Browser shows which browsers accessed your website.
image: https://developers.cloudflare.com/core-services-preview.png
---
[Skip to content](#%5Ftop)
Was this helpful?
YesNo
[ Edit page ](https://github.com/cloudflare/cloudflare-docs/edit/production/src/content/docs/web-analytics/data-metrics/dimensions.mdx) [ Report issue ](https://github.com/cloudflare/cloudflare-docs/issues/new/choose)
Copy page
# Dimensions
Dimensions are the labels used to describe different types of metrics or data. For example, **Referer** is the data collected from external links referring visits to a page, while **Browser** shows which browsers accessed your website.
Below you can find a list of the different dimensions you can use to filter Web Analytics:
* **Country**: The visitor's country.
* **Host**: The domain of the site's URL.
* **Path**: The links within your site referring visits to a page.
* **Referer**: The external links referring visits to a page. You can access `referer host` data on the dashboard. Additionally, you can access data for the `referer path` from the GraphQL API.
* **Device type**: The device visitors use to access a page (for example, desktop, mobile, or tablet).
* **Browser**: The web browser (for example, Chrome, Safari) visitors use to access your website.
* **Operating system**: The operating system visitors use to access a page.
* **Site**: The website's domain name. Used for high-level segmentation of data. For example, you can use it for a particular zone or gray-clouded website.
* **Exclude Bots**: Exclude bot traffic from the dataset. With this dimension set to `Yes`, the resulting dataset will be a closer representation of real user traffic.
```json
{"@context":"https://schema.org","@type":"BreadcrumbList","itemListElement":[{"@type":"ListItem","position":1,"item":{"@id":"/directory/","name":"Directory"}},{"@type":"ListItem","position":2,"item":{"@id":"/web-analytics/","name":"Cloudflare Web Analytics"}},{"@type":"ListItem","position":3,"item":{"@id":"/web-analytics/data-metrics/","name":"Data and metrics"}},{"@type":"ListItem","position":4,"item":{"@id":"/web-analytics/data-metrics/dimensions/","name":"Dimensions"}}]}
```
---
---
title: High-level metrics
description: Understanding the key metrics in web analytics is essential for optimizing your website’s performance and user experience. Here are the high-level metrics tracked by Cloudflare Web Analytics:
image: https://developers.cloudflare.com/core-services-preview.png
---
[Skip to content](#%5Ftop)
Was this helpful?
YesNo
[ Edit page ](https://github.com/cloudflare/cloudflare-docs/edit/production/src/content/docs/web-analytics/data-metrics/high-level-metrics.mdx) [ Report issue ](https://github.com/cloudflare/cloudflare-docs/issues/new/choose)
Copy page
# High-level metrics
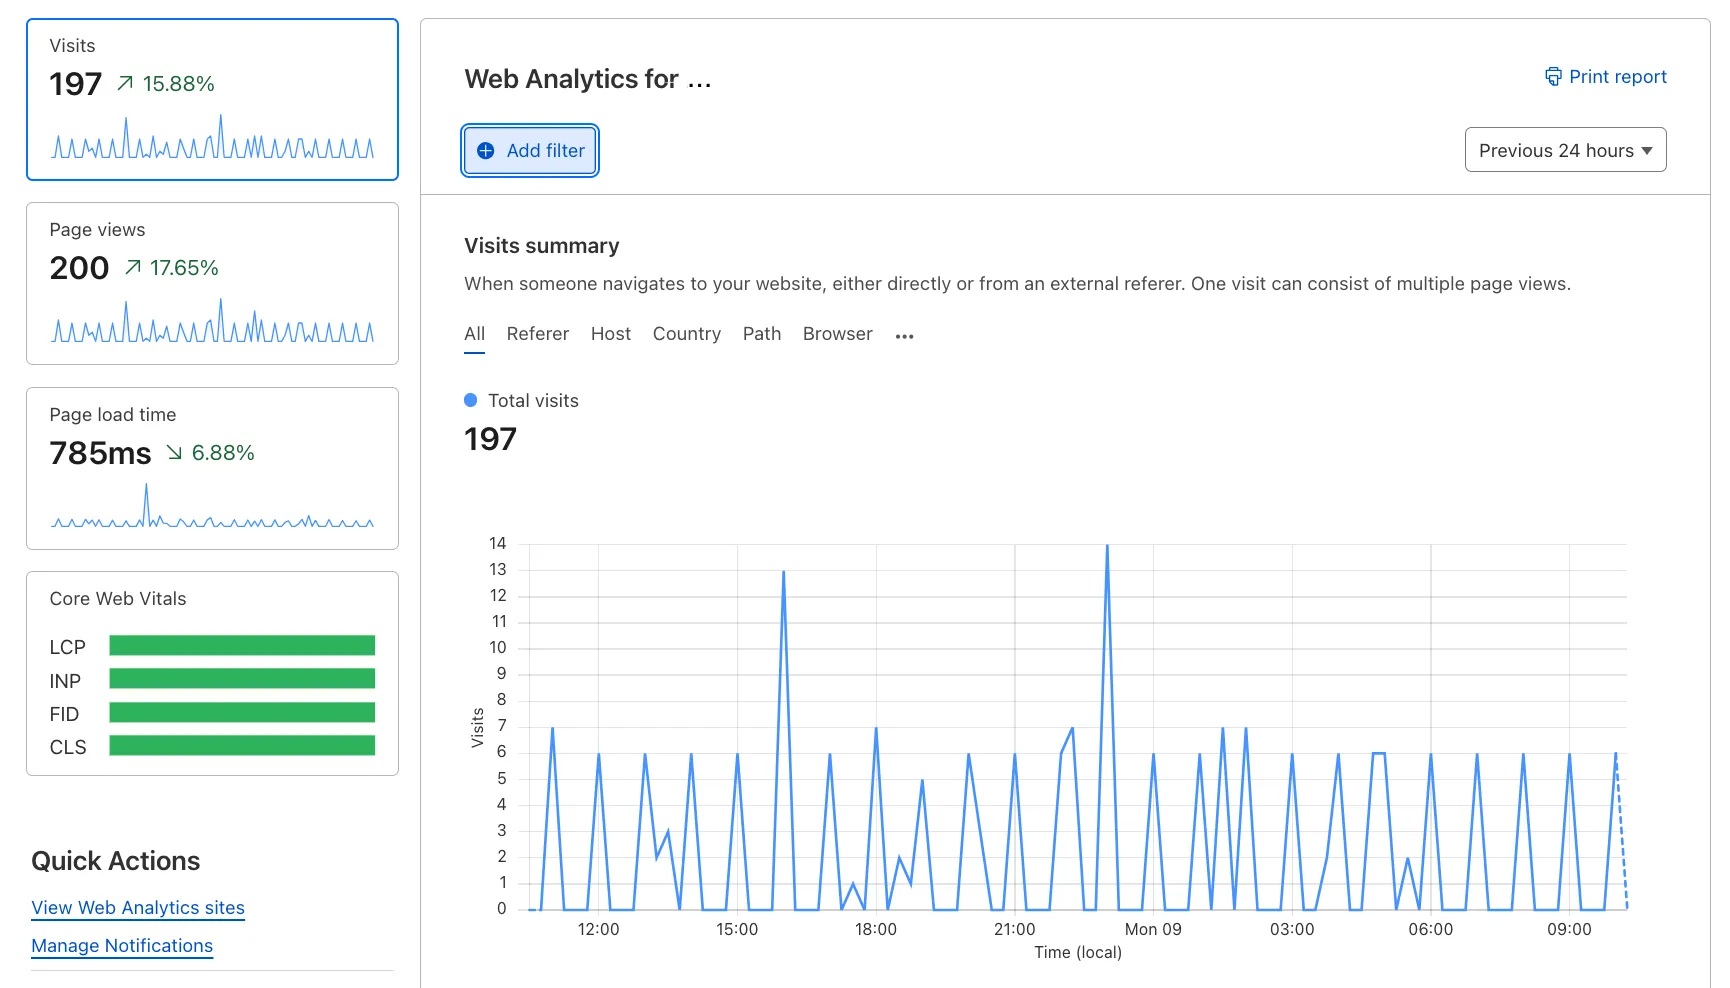
Understanding the key metrics in web analytics is essential for optimizing your website’s performance and user experience. Here are the high-level metrics tracked by Cloudflare Web Analytics:
* **Visits** \- A page view that originated from a different website or direct link. Cloudflare checks where the HTTP referer does not match the hostname. One visit can consist of multiple page views.
* **Page views** \- A successful HTTP response with a content-type of HTML.
* **Page load time** \- The total amount of time required to load the page.
* **[Core Web Vitals ↗](https://www.cloudflare.com/learning/performance/what-are-core-web-vitals/)** \- Higher-level metrics designed by Google to capture the user experience more completely.
```json
{"@context":"https://schema.org","@type":"BreadcrumbList","itemListElement":[{"@type":"ListItem","position":1,"item":{"@id":"/directory/","name":"Directory"}},{"@type":"ListItem","position":2,"item":{"@id":"/web-analytics/","name":"Cloudflare Web Analytics"}},{"@type":"ListItem","position":3,"item":{"@id":"/web-analytics/data-metrics/","name":"Data and metrics"}},{"@type":"ListItem","position":4,"item":{"@id":"/web-analytics/data-metrics/high-level-metrics/","name":"High-level metrics"}}]}
```
---
---
title: Page load time
description: Page load time summary gives you an overview of how long your web page takes to load, broken down by area. To access Page load time:
image: https://developers.cloudflare.com/core-services-preview.png
---
[Skip to content](#%5Ftop)
Was this helpful?
YesNo
[ Edit page ](https://github.com/cloudflare/cloudflare-docs/edit/production/src/content/docs/web-analytics/data-metrics/page-load-time-summary.mdx) [ Report issue ](https://github.com/cloudflare/cloudflare-docs/issues/new/choose)
Copy page
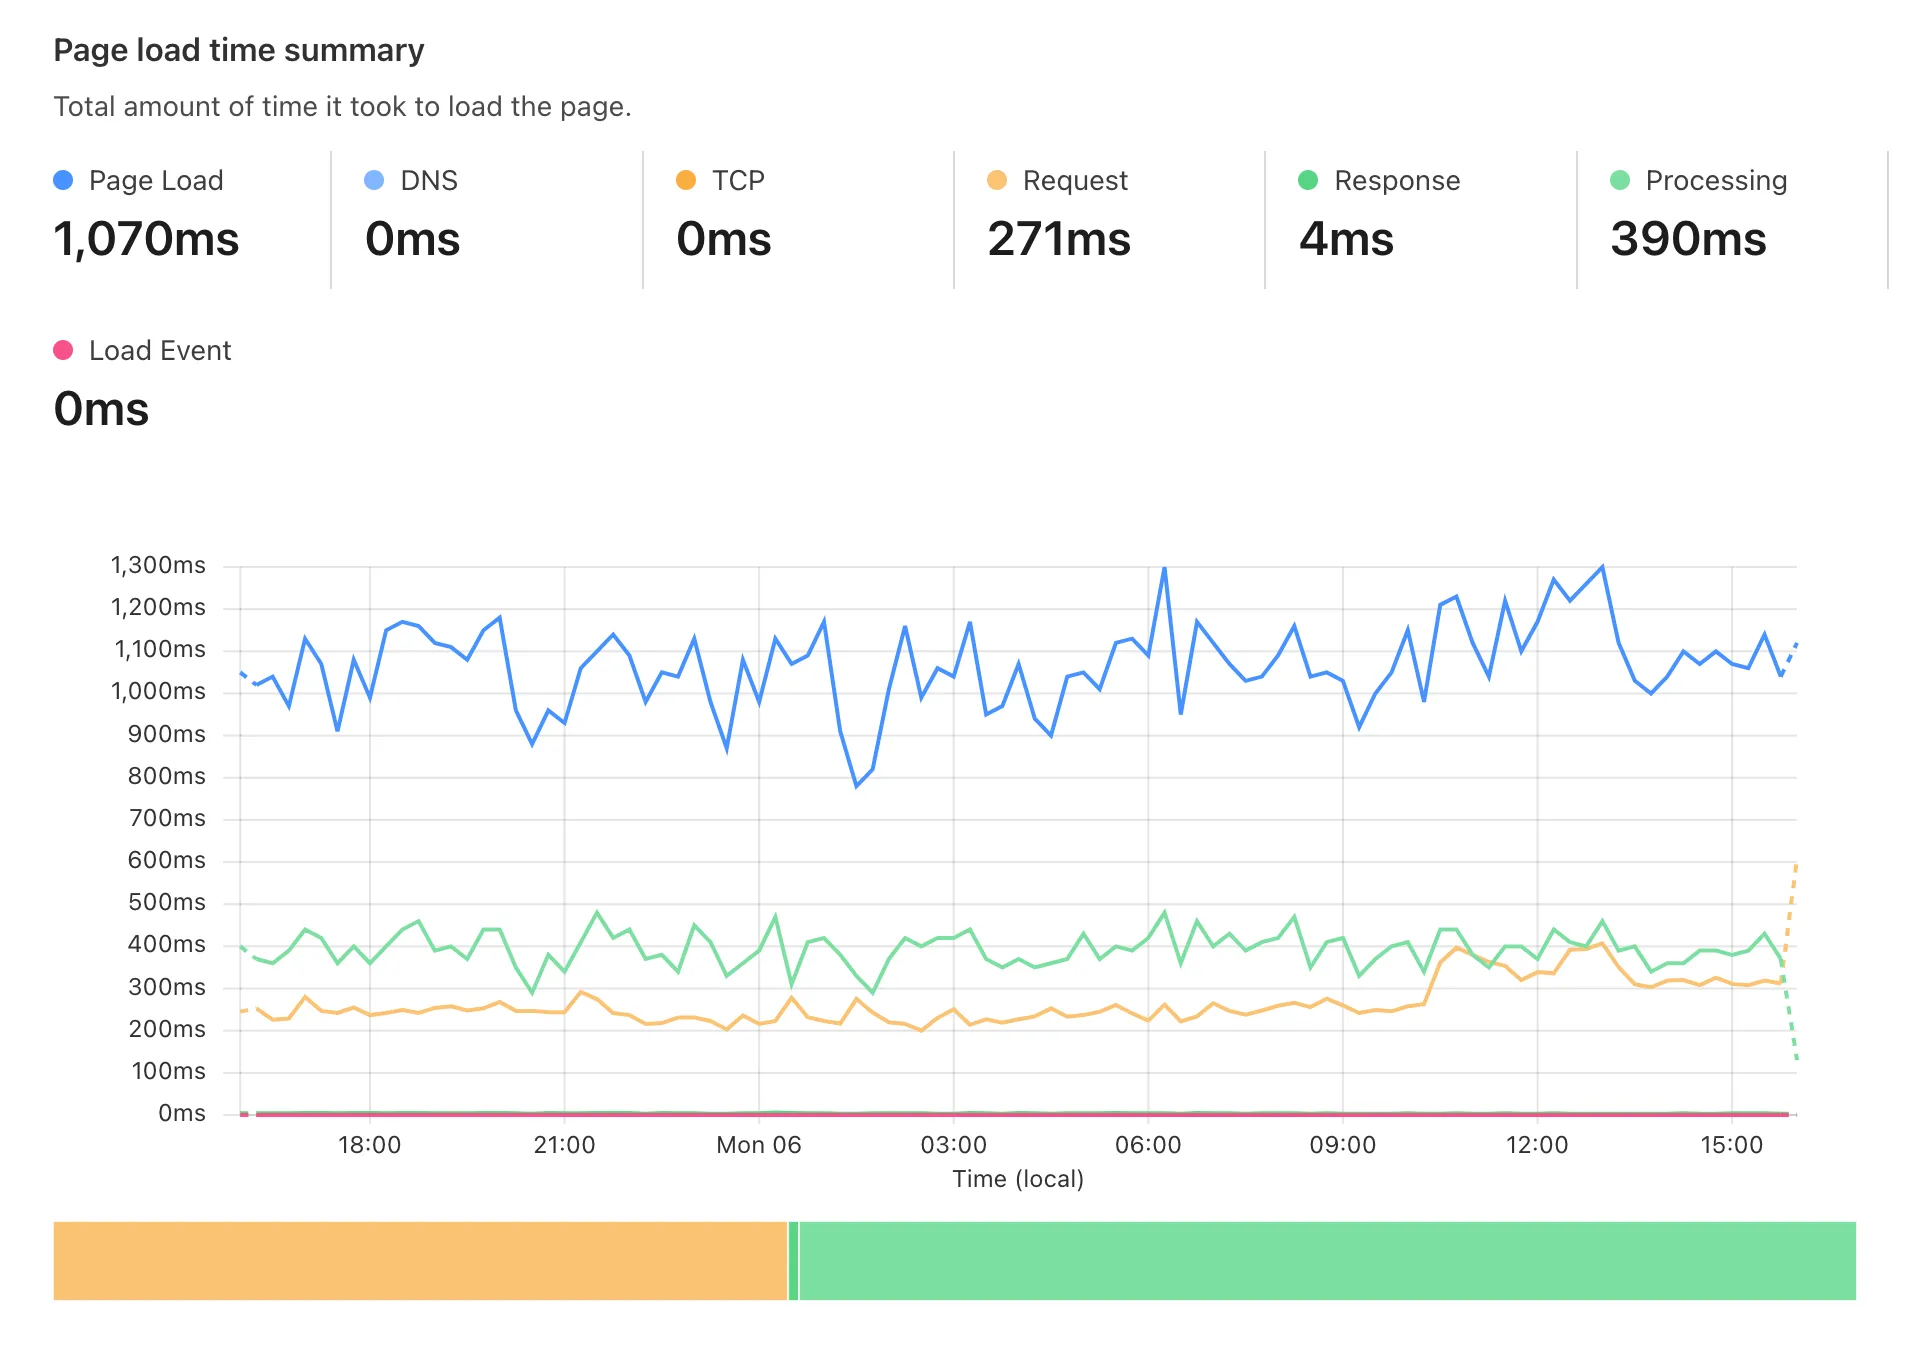
# Page load time
Page load time summary gives you an overview of how long your web page takes to load, broken down by area. To access Page load time:
1. Go to [Web Analytics ↗](https://dash.cloudflare.com/?to=/:account/web-analytics) from your account home page, and choose a website.
2. Select **Page load time**.
## Components
Below is a list of all the components you can inspect:
### Page load
The total amount of time required to load the page. Note that page load time does not correspond to the sum of the other timings available in Web Analytics. This happens because the page load time also includes timings that are not displayed, such as pre-DNS lookup timings and unattributed gaps between timing metrics.
### DNS (`domainLookupEnd` \- `domainLookupStart`)
How long a DNS query takes. This could appear as zero for reused connections or content stored in the local cache (memory or disk).
### TCP (`connectEnd` \- `connectStart`)
How long it takes to establish a TCP connection with the server. If using HTTPS, this process includes TLS negotiation time.
### Request (`responseStart` \- `requestStart`)
The time elapsed between making an HTTP request and receiving the first byte of the response.
### Response (`responseEnd` \- `responseStart`)
The time elapsed between the first byte and the last byte of the received response. Think of this as a resource download time.
### Processing (`domComplete` \- `domInteractive`)
How long it took to render the page. This includes loading any resources that block page rendering, including images, scripts, and style sheets. If this number is big, optimize your document architecture, resource size, or configure settings in the Cloudflare Speed app. This document process can be drilled down more with `domInteractive`, `domContentLoadedEventStart`, `domContentLoadedEventEnd`, and `domComplete`.
### Load Event (`loadEventEnd` \- `loadEventStart`)
An event triggered by the browser when a document and its resources finish loading. The Load Event duration may be a useful metric if you have additional functions or any logic for the load event.
## Data collected for Paint Timings
To make Web Analytics work, Cloudflare collects several types of data points. These are the additional data points collected for Paint Timings:
### First Paint
The time between navigation and when the browser renders the first pixels to the screen.
### First Contentful Paint
Time when the browser renders the first bit of content from the DOM.
```json
{"@context":"https://schema.org","@type":"BreadcrumbList","itemListElement":[{"@type":"ListItem","position":1,"item":{"@id":"/directory/","name":"Directory"}},{"@type":"ListItem","position":2,"item":{"@id":"/web-analytics/","name":"Cloudflare Web Analytics"}},{"@type":"ListItem","position":3,"item":{"@id":"/web-analytics/data-metrics/","name":"Data and metrics"}},{"@type":"ListItem","position":4,"item":{"@id":"/web-analytics/data-metrics/page-load-time-summary/","name":"Page load time"}}]}
```